This is a continuation of a series. If you haven't read the previous post, click here to be taken up to speed. I'll assume you've read it going forward.
Last time, we went over performing string extraction on the VM, and scratched the surface of analyzing the execution itself. However, this leaves the significant problem of actually devirtualizing the bytecode. For instance, we mentioned that individual strings are difficult to extract in a static manner—as specific values of the instruction pointer are required—but this difficulty also applies to opcodes and registers. As the bytecode is a stream of numbers, it's impossible to determine whether a number indicates a register, opcode, or constant without knowing what came before it.
To solve this problem we must construct a disassembler. Starting with conventional disassembly methodologies, we will attempt to disassemble the virtual machine's bytecode, and eventually touch on some of the basic building blocks necessary to both restore control flow and generate JavaScript pseudocode.
I will not be examining the bytecode program in detail, including any fingerprinting taking place. Instead, I will be converting it to a format that is more easily understandable by humans. Although I am releasing a significant amount of code with this post, I have no plans to keep any of it up to date. The point of open sourcing this information is for people to learn from my thought process and methodology.
Bytecode Traversal
In a linear sweep, the program is read from the first byte, interpreting every subsequent byte not used as a read or write as another instruction. This kind of disassembly can be easily fooled by the insertion of bloat, or other unreachable code. Worse still, if tricked into misinterpreting a single value, a linear sweep will misinterpret all subsequent values.
In a recursive traversal, the disassembler begins identically to a linear sweep. However, jump instructions are followed, and conditional jumps are "branched" and stored to be disassembled later. In this manner, we can begin to analyze control flow, and identify functions definitions or loops. This type of disassembly is much more difficult to fool as it only disassembles code that can be reached, starting from points that are confirmed to be instructions. However, it is still susceptible to bloat, as static recursive traversal can not identify when a branch is impossible.
In the interest of staying true to what a disassembler should be, and making things a little bit more fun, we will perform our transformations without actually running the VM. Analyzing the script in our browser's debugger only lets us see the code ran in our specific environment. Certain cases could trigger differently in a separate environment. Either way, our goal is full source code retrieval. This requires solving the system in the most complete manner possible. Further, we will not be storing any values, or evaluating the outcome of any operations. Any functionality that resembles "executing" the bytecode will not be allowed. My reasoning for this is two-fold:
- If operations are evaluated, or written into registers, what is the difference between our disassembly and simply inserting some log statements? Once that line is crossed, anything we are doing can be performed more efficiently and easily in a fully dynamic manner. In fact, attempting to evaluate operations will necessitate a browser or webdriver due to the high frequency of browser property calls. As mentioned previously, this would only allow us to analyze the code triggered in that environment.
- Dumping every operation's internal calculations, as well as where and how certain things are being stored offers a level of transparency that can be easily missed otherwise. This is the difference between the following two logs:
INIT MEMORY 55
ADD 3 + 2 -> reg2
SET MEMORY reg2 -> 55
INIT MEMORY 55
ADD 3 + 2 -> reg2
SET MEMORY 5 -> 55
As you can see, it's extremely useful for us to know exactly where a value is coming from, often moreso than the value itself. While we could simply log both the initial values and ensuing result, it adds very little to our analysis and webdrivers require costly overhead.
However, we also need an initial value to begin interpreting from. Luckily, we can tell from reading the script that the VM execution starts from the first index's (read: second) value in the bytecode array. This is apparent from the value of the instruction pointer in a newly initialized state.
var n = [1, // Starting instruction pointer
{
    h: a,
    M: null,
    $: [],
    g: function () {
        return [0]
    },
    j: function () {
        return [0]
    },
    O: function () { }
}, void 0];
Opcode Identification
Now that we know that the byte at [1] is definitely an opcode, we can begin reading from there. However, to understand the meaning of an opcode and determine when the next opcode is, we need to examine the opcode definitions.
While some opcodes are simple, such as the ADD instruction:
m(n, M(n) + M(n))
Others can be much more complex. For the purpose of this article, I will only go over some of the more complicated opcodes. For a comprehensive list of opcodes, see my repository here.
However, we only require certain information from each opcode. If we aren't evaluating expressions or maintaining a stack, what's left? Well, we know from the previous article that we need to track the instruction pointer. By condensing every opcode down to how it mutates the instruction pointer, we can pull constants from the bytecode, identify the registers used in calculations, and see where results are stored. Additonally, other instruction pointer values indicated by opcodes are highly relevant to recursive traversal. For example, if an opcode indicates a function is defined at a certain address, we should add that location to our disassembly queue.
Now that we understand our task, we can begin looking at the opcodes. One of the first opcodes that caught my eye was opcode 50:
var r = M(n)
    , t = M(n)
    , i = M(n)
    , o = p(n)
    , u = function () {
        var n = $();
        n.g[3] = arguments;
        for (var t = 0; t < arguments.length; t++)
            n.g[t + 4] = arguments[t];
        return n.g[1] = {
            h: this,
            g: function () {
                return [0]
            },
            j: function () {
                return [0]
            },
            $: [],
            O: d(o, l),
            M: u
        },
            n.g[0] = r,
            S(n),
            n.g[2]
    };
try {
    Object.defineProperty(u, "length", {
        value: i
    }),
        Object.defineProperty(u, "name", {
            value: t
        })
} catch (n) {
    // omitted
}
u[v] = {
    T: r,
    O: d(o, l),
    L: u
},
    m(n, u)
It's clear that this opcode reads twice, creates a function, and then binds certain properties to that function before writing it into a register. But we should seek to understand it on the bytecode level. Reading the syntax of u() starts to paint a picture. u() creates a new state, loads the function's arguments into its registers, sets the instruction pointer to the value of r, and executes a new stepper function. After the stepper completes execution u() returns the value in register 2.
This behavior is highly interesting. Namely,u() seems to indicate that a section of the bytecode program is meant to be reusable, as well as ran within its own scope with certain provided arguments. This is precisely what a function definition in the bytecode would look like. But if this opcode defines a function, how is it called? To answer this question, we direct our attention to opcode 23.
var t = M(n)
    , r = M(n)
    , i = M(n);
if (void 0 === t && j() && (t = a),
    r[v] && r[v].L === r) {
    n.g = [r[v].T, {
        h: t,
        M: r,
        g: d(n.g, h),
        j: d(h(), h),
        $: [],
        O: r[v].O
    }, void 0, function () {
        return arguments
    }
        .apply(void 0, F(i))];
    for (var o = 0; o < i.length; o++)
        n.g.push(i[o])
} else if (r.toString)
    n.g[2] = r.apply(t, i);
Examining the conditional logic, it's clear that the primary discriminator between the if (alternate) and the else if (consequent) cases are the existence of certain properties on r. Otherwise, the alternate case would not be valid.
At this stage of the reversal, it's impossible to say what the first case does without seeing some examples. While debugging, we can see that the only values passed into the alternate case are functions of type u(). This is an amazing stroke of luck, as the whole opcode now holds meaning. It defines a new state, with instruction pointer set to the same pointer as u (see the last few lines of opcode 50), and overwrites the VM state to the new one. This is exactly what we would expect from a function call instruction. Reading further, we see that values from i are pushed into the new state's registers. These are the function's arguments. This interpretation, as well as the theorized standard return to register 2, is further corroborated by the else if. This case runs a function from the bytecode, returning the function's result to register 2.
Continuing this chain of logic, bytecode function calls need a return operation. Opcodes 48 and 49 provide this functionality, both being calls to w(n, t).
function p(n) {
    return n.g[1]
}
function w(n, t) {
    var r = p(n);
    r.C = {
        k: t
    },
        r.N ? n.g[0] = r.N : (n.g = r.g(),
            n.j = h(),
            n.g[2] = t)
}
The only difference between the two opcodes being whether or not a value is provided for t. Looking at p(n), we see that it returns the current state. w(n, t) then sets a value in the state, executes a jump under certain conditions, and otherwise overrides the current state before returning the value of t to register 2. This is exactly what we would expect from a return operation. But what about the jump? While I am not entirely sure, as dynamic analysis of bytecode function calls has proven to be difficult due to the amount of nested calls, only three opcodes will occasionally cause the VM to jump to a value stored in the state object. Two represent returns, and one handles errors. It's more than likely these values are also used to restore the VM to a previous instruction pointer. Analysis of the produced disassembly should provide further context to this functionality.
However, we have forgotten an important piece of the puzzle. Thus far, u() has never actually been called! In order to fully understand bytecode function calls, we need to analyze where/how u() is actually called. However, breakpointing and stepping through every call manually would be a lengthy process, unlikely to impart much useful information. Luckily, debugging wizard and Chrome Dev Tools engineer Paul Irish got in touch with me and provided amazing advice on tackling this issue. Check out his blog/socials if you haven't already.
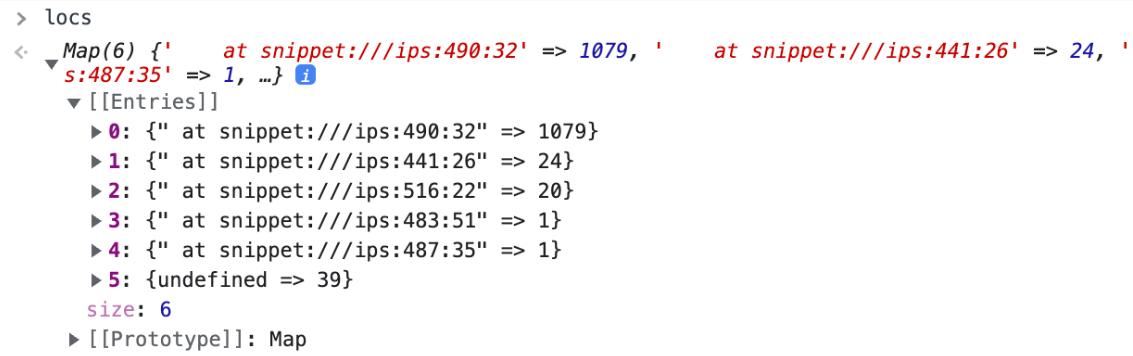
After Paul gave me some DevTools tips, and explained the meanings of .bind() and .apply() to me numerous times (sorry, Paul), he sent me the following snippet to log all callers of u():
globalThis.locs = globalThis.locs ?? new Map();
const stack = new Error('').stack.split('\n');
const calleeloc = stack.filter(s => s.includes('ips.js')).at(1);
let sum = locs.get(calleeloc) ?? 0;
locs.set(calleeloc, ++sum);
By inserting this code inside of u() and evaluating locs in console, we could see all the places it is invoked. The alternate case in the opcode is straightforward, but the other two cases are more perplexing, contributing to some of the script's unusual features.
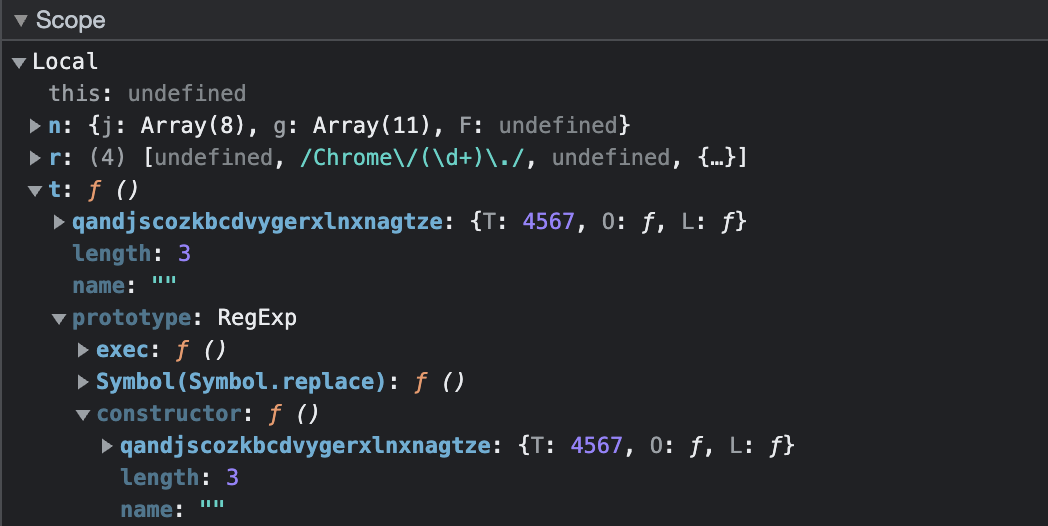
The first case is opcode 24:
var t = M(n)
    , r = M(n).slice();
r.unshift(void 0),
    m(n, new (Function.bind.apply(t, r)))
Debugging this opcode, we find something strange. u() is ran here as the value t, but how could new possibly be executing it? Looking at the prototype and constructor properties of t reveals some strange behavior. Namely, in both cases the constructor of t has been overwritten to call u(), and is sometimes nested within an entirely different prototype. Once again, thanks to Paul Irish for helping me isolate and analyze this behavior.
Interesting behavior, but now that we have identified it, we can handle it accordingly. Specifically, we should remember this edge case when opcode 24 occurs in our disassembly.
The next u() call comes from opcode 10:
m(n, M(n)[M(n)])
How does this call a function, you might be wondering? Checking dynamically we can see that, like above, specific methods have been overwritten. In this case, the first value's "getters" have been overwritten to call u().
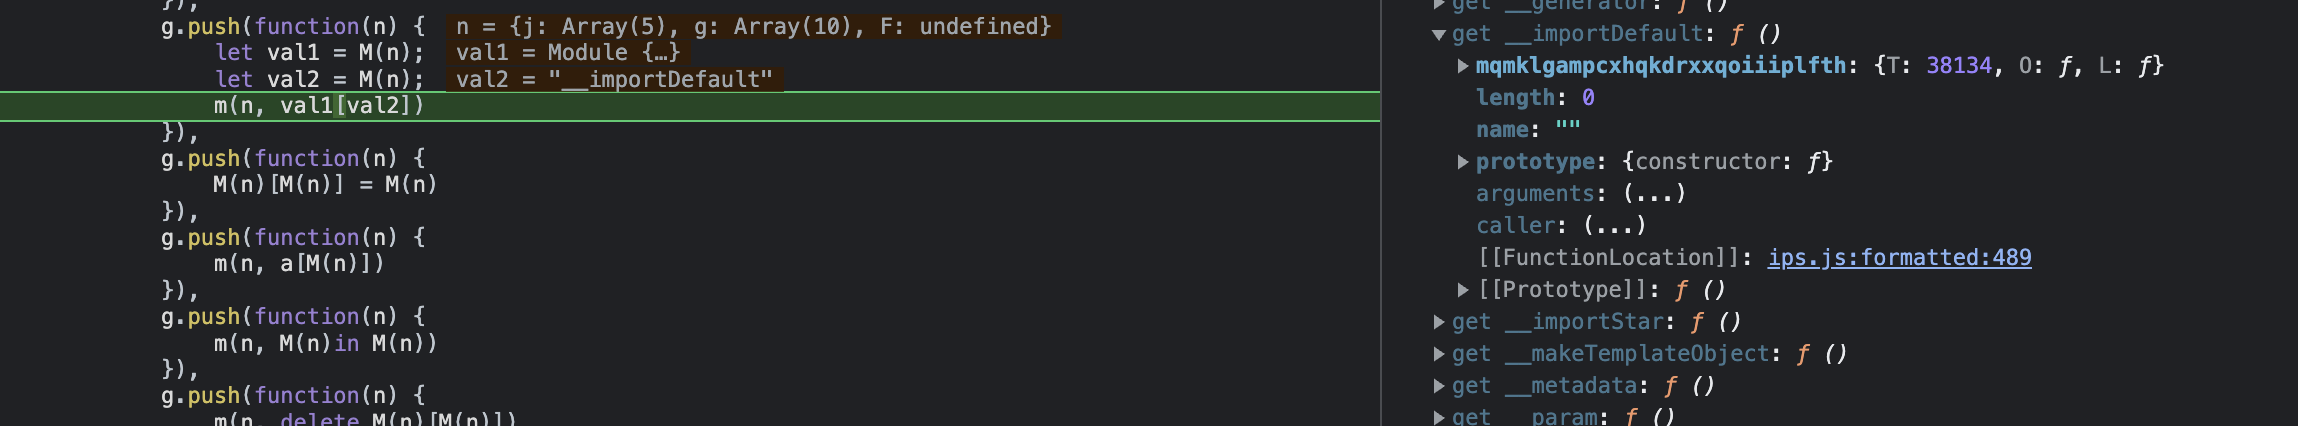
Once again, now having understood this behavior we can see that it is not particularly relevant to our disassembler. We need only keep it in mind when interpreting our disassembly.
However, if you're anything like me you might be wondering: "Why even have two ways to call functions?" The answer to this question comes from conventional compilers, and lies in the difference between inlining a function and calling it normally. In this case, a call to u() represents a regular function call, whereas the first kind of function call we covered is an inline call. More on the difference here. Thanks to Musicbot for telling me this obscure compiler fact. Much credit in solving this problem is also due to my good friend Nic Perez, who painstakingly debugged most of these calls with me.
Recursive Traversal
Now that we understand each opcode, a linear sweep is easy to implement. However, there are still some recursive traversal related complications.
Firstly, we know that we have to follow jumps. This can be implemented as shown below.
do: function (disassembler) {
    let val1 = disassembler.getValue();
    // if we are not performing a linear sweep
    if (disassembler.mode == "step") {
        disassembler.state.ptr = val1;
    }
    disassembler.state.trace.push('JUMP       ' + val1);
}
But how can we handle conditional jumps without knowing which case is true? As discussed before, we must follow both branches. This will produce two "branches" at each jump. Then after the main disassembly has finished, we can begin to recursively disassemble the next branch in the queue. Restoring these branches to where they are spawned will be discussed later on, along with other aspects of cleaning the disassembly.
0x27: {
    // M(n) ? M(n) : n.g[0] = M(n)
    name: 'JUMP IF FALSE',
    do: function (disassembler) {
        let val1 = disassembler.getValue();
        let val2 = disassembler.getValue();
        disassembler.state.trace.push('JUMP IF FALSE      ' + val1 + ' TO: ' + val2 + " | " + disassembler.state.register[0]);
        if (disassembler.mode == "step") {
            disassembler.branch(val2)
            disassembler.branch(disassembler.state.ptr)
            disassembler.shouldStop = true;
        }
    }
},
0x28: {
    // M(n) ? n.g[0] = M(n) : M(n)
    name: 'JUMP IF TRUE',
    do: function (disassembler) {
        let val1 = disassembler.getValue();
        let val2 = disassembler.getValue();
        disassembler.state.trace.push('JUMP IF TRUE       ' + val1 + ' TO: ' + val2 + " | " + disassembler.state.register[0]);
        if (disassembler.mode == "step") {
            disassembler.branch(val2)
            disassembler.branch(disassembler.state.ptr)
            disassembler.shouldStop = true
        }
    }
},
Lastly, I perform a similar operation when I encounter a bytecode function definition or a pointer value is saved to the state, marking it for later disassembly.
The Part Where I Actually Write Some Code
Putting it all together, I implemented my disassembler class as shown below.
module.exports = class Disassembler {
    constructor(bytecodeArr, decodedString) {...
    }

    getRegister() {...
    }

    getValue() {...
    }

    // creates a conditional branch given instruction pointer value to jump to, and adds it to the branches array for later disassembly.
    branch(ptr) {
        if (this.scannedBranches.has(ptr)) {
            return;
        }
        this.branches.add(ptr);
    }

    // creates a function given instruction pointer value to jump to, and adds it to the functionPointers array for later disassembly.
    function(ptr) {
        if (this.scannedFunctions.has(ptr)) {
            return;
        }
        this.functionPointers.add(ptr);
    }

    // Traverses the bytecode by following the instruction pointer, either linearly or recursively depending on this.mode
    // The current value of the instruction pointer is stored in this.state, along with the trace currently being built
    step(mode, ptr) {
        this.mode = mode;
        this.shouldStop = false;
        this.state = {
            ptr: ptr,
            trace: []
        }

        while (!this.shouldStop) {
            let ptr = this.state.ptr++;
            // records that we have scanned this ptr value
            this.scanned[mode].add(ptr);

            let opcode = opcodes[this.bytecodeArr[ptr]];

            if (!opcode || null === opcode.do) {
                this.state.trace.push("TERM");
                this.shouldStop = true;
            } else {
                opcode.do(this);
            }

            // reformat opcode trace to have the pointer value in front
            let op = this.state.trace[this.state.trace.length - 1];
            let newOp = ptr + " " + op;
            this.state.trace[this.state.trace.length - 1] = newOp;
        }

        return this.state.trace
    }
}
The step function steps through the bytecode array, executing each opcode given by the instruction pointer. Each opcode then performs our skeletal implementation of it—reading, writing, and jumping. This results in the instruction pointer being ready to read another opcode upon completion. For a linear sweep, this will continue until the end of the array. For a recursive traversal, until no new code is discovered. The branch() function is used to store a pointer value for later, and both getRegister() and getValue() are implemented identically to the original script.
Lastly, in order to process our branches and functions, I added a scanPointers() method.
// Calls step() on all functions and branches defined in the main trace, until no new functions or branches have been discovered
// May make improvements to the branching logic later to reduce repeated non starting pointer instructions in branch traces
scanPointers() {
	if (this.functionPointers.size > 0) {
		let fptr = this.functionPointers.values().next().value;
		this.functionPointers.delete(fptr);
		this.scannedFunctions.add(fptr);

		let ftrace = this.step("step", fptr);

		this.functionTraces[fptr] = ftrace;
		this.scanPointers();
	} else if (this.branches.size > 0) {

		let bptr = this.branches.values().next().value;
		this.branches.delete(bptr);
		this.scannedBranches.add(bptr);

		let btrace = this.step("step", bptr);

		this.branchTraces[bptr] = btrace;

		this.scanPointers();
	}
	if (this.functionPointers.size === 0 && this.branches.size === 0) {
		return { funcTraces: this.functionTraces, branchTraces: this.branchTraces }
	}
}
This class, combined with our implementations of each opcode and our research in the last post, complete our disassembler. To run my disassembler yourself, and to see the rest of the code, click here. Finally, my main file looks like
const fs = require("fs");
const decoder = require('./bytecode.js');
const disassembler = require('./disassembler.js');
const { findIntervals } = require('./util.js');

const bytecode = fs.readFileSync("./bytecode/bytecode.txt", "utf8");

let decodedBytecode = decoder.decryptBytecode(bytecode);

// splices the string section of the bytecode
let stringIndex = decodedBytecode[decodedBytecode.length - 1] ^ decodedBytecode.length;
let bytecodeStrings = decodedBytecode.splice(stringIndex, decodedBytecode[stringIndex + 1] + 2);

let decodedStrings = decoder.decodeString(bytecodeStrings, [0]);

let MainDisassembler = new disassembler(decodedBytecode, decodedStrings);

console.log("Performing linear scan...");
let scan = MainDisassembler.step("scan", 1);
fs.writeFileSync("./output/" + "scan" + ".json", JSON.stringify(scan));
console.log("Linear scanning has recovered " + (MainDisassembler.scanned["scan"].size) + " out of " + decodedBytecode.length + " instructions.");

console.log("Starting recursive traversal");
console.log("Disassembling main function...");
let trace = MainDisassembler.step("step", 1);
fs.writeFileSync("./output/main.json", JSON.stringify(trace));

console.log("Disassembling functions and branches...");
let { funcTraces, branchTraces } = MainDisassembler.scanPointers();
fs.writeFileSync("./output/functions" + ".json", JSON.stringify(funcTraces));
fs.writeFileSync("./output/branches" + ".json", JSON.stringify(branchTraces));

console.log("Recursive traversal has recovered " + (MainDisassembler.scanned["step"].size) + " out of " + decodedBytecode.length + " instructions.");

let unscanned = [];
for (let i = 1; i < decodedBytecode.length; i++) {
    if (!MainDisassembler.scanned["step"].has(i)) {
        unscanned.push(i);
    }
}
let intervals = findIntervals(unscanned);
fs.writeFileSync("./output/unscanned" + ".json", JSON.stringify(intervals));
Interpreting Disassembly
$ npm start

> kasada-disassembler@1.0.0 start
> node src/index.js

Performing linear scan...
Linear scanning has recovered 187424 out of 187426 instructions.
Starting recursive traversal
Disassembling main function...
Disassembling functions and branches...
Recursive traversal has recovered 186690 out of 187426 instructions.
Running our disassembler gives us outputs of the following form, where the first number is the instruction pointer, followed by my representation of the opcode:
"5980 EMPTY OBJECT        -> reg4",
"5982 GET WINDOW PROP        KPSDK -> reg5",
"5987 GET        reg5[start] -> reg6",
"5993 PUT        reg4[jln] = reg6",
"5999 GET WINDOW PROP        KPSDK -> reg5",
"6004 GET        reg5[scriptStart] -> reg6",
"6010 PUT        reg4[uwx] = reg6",
"6016 GET WINDOW PROP        KPSDK -> reg6",
"6021 GET        reg6[now] -> reg7",
"6027 EMPTY ARRAY        -> reg8",
"6029 CALL FUNCTION        OBJ: reg6 FUNC: reg7 ARGS: reg8",
"6033 SET        reg2 -> reg5",
"6036 PUT        reg4[rbp] = reg5",
"6042 SET MEMORY ELEMENT IF INIT        274 = reg4",
"6045 SET MEMORY ELEMENT IF INIT        275 = false",
"6048 SET MEMORY ELEMENT IF INIT        276 = ",
"6053 GET WINDOW PROP        window -> reg4",
"6058 SET MEMORY ELEMENT IF INIT        277 = reg4",
"6061 GET WINDOW PROP     window -> reg4",
"6066 GET        reg4[document] -> reg5",
"6072 GET        reg5[documentMode] -> reg4",
"6078 NOT        reg4 -> reg5",
"6081 NOT        reg5 -> reg4",
"6084 SET MEMORY ELEMENT IF INIT        278 = reg4",
"6087 PUSH MEMORY ELEMENT IF INIT        278 -> reg4",
"6090 NOT        reg4 -> reg5",
This is much easier to read and understand than simply stepping through the VM dynamically. It also makes it possible for us to evaluate conditional jumps, such as in the example below.
"5927 STRICT EQUAL        t === t -> reg4",
"5935 SET MEMORY ELEMENT IF INIT        272 = reg4",
"5938 STRICT EQUAL        t === t -> reg4",
"5946 SET MEMORY ELEMENT IF INIT        273 = reg4",
"5949 EMPTY OBJECT        -> reg4",
"5951 SET MEMORY ELEMENT IF INIT        274 = reg4",
"5954 PUSH MEMORY ELEMENT IF INIT        272 -> reg4",
"5957 JUMP IF FALSE        reg4 TO: 5977 | 5960"
It's easy to see that the value in register 4 is true, and hence a jump does not occur and we should continue from the branch at instruction pointer value 5960. While this isn't how conventional two to three operand architecture is implemented, it has been formatted for readability. In the future, when parsing the disassembler's output it may be helpful to standardize the format.
A few points on interpreting the disassembly, for those interested.
There are a few loop structures that are immediately apparent. Look for branches that conditionally jump back to the beginning of the branch. See what other kinds of syntax patterns you notice, and think about what they might look like pre-compilation.
When reading through the disassembler's output, and especially when attempting to reconstruct control flow, it is important to keep edge cases in mind, such as those discussed in the opcode section. For example, both opcodes 10 and 24 are capable of calling subroutines, which might not be immediately obvious from the disassembled bytecode. Additionally, there are a few other opcodes that are capable of performing dynamic jumps that the static disassembler cannot follow. For opcodes such as these, like opcode 48, or 47, it is important to read the surrounding calls to understand their effect.
Similarly, it's important to keep scope in mind. For instance, when interpreting a function's bytecode, or reading through a branch, it's important to remember which registers or memory values are accessible from within that scope. Otherwise, you may become confused with all of the reading and writing that occurs.
The disassembler does not read all the instructions in either scan. In a linear sweep, this is due to the execution beginning at the second element of the bytecode array, and the program terminating before the final value of the instruction pointer. In the case of recursive traversal, this is due to a certain amount of the bytecode being unreachable bloat. It's easy to verify that none of the values not covered by recursive traversal are ever actually reached in browser.
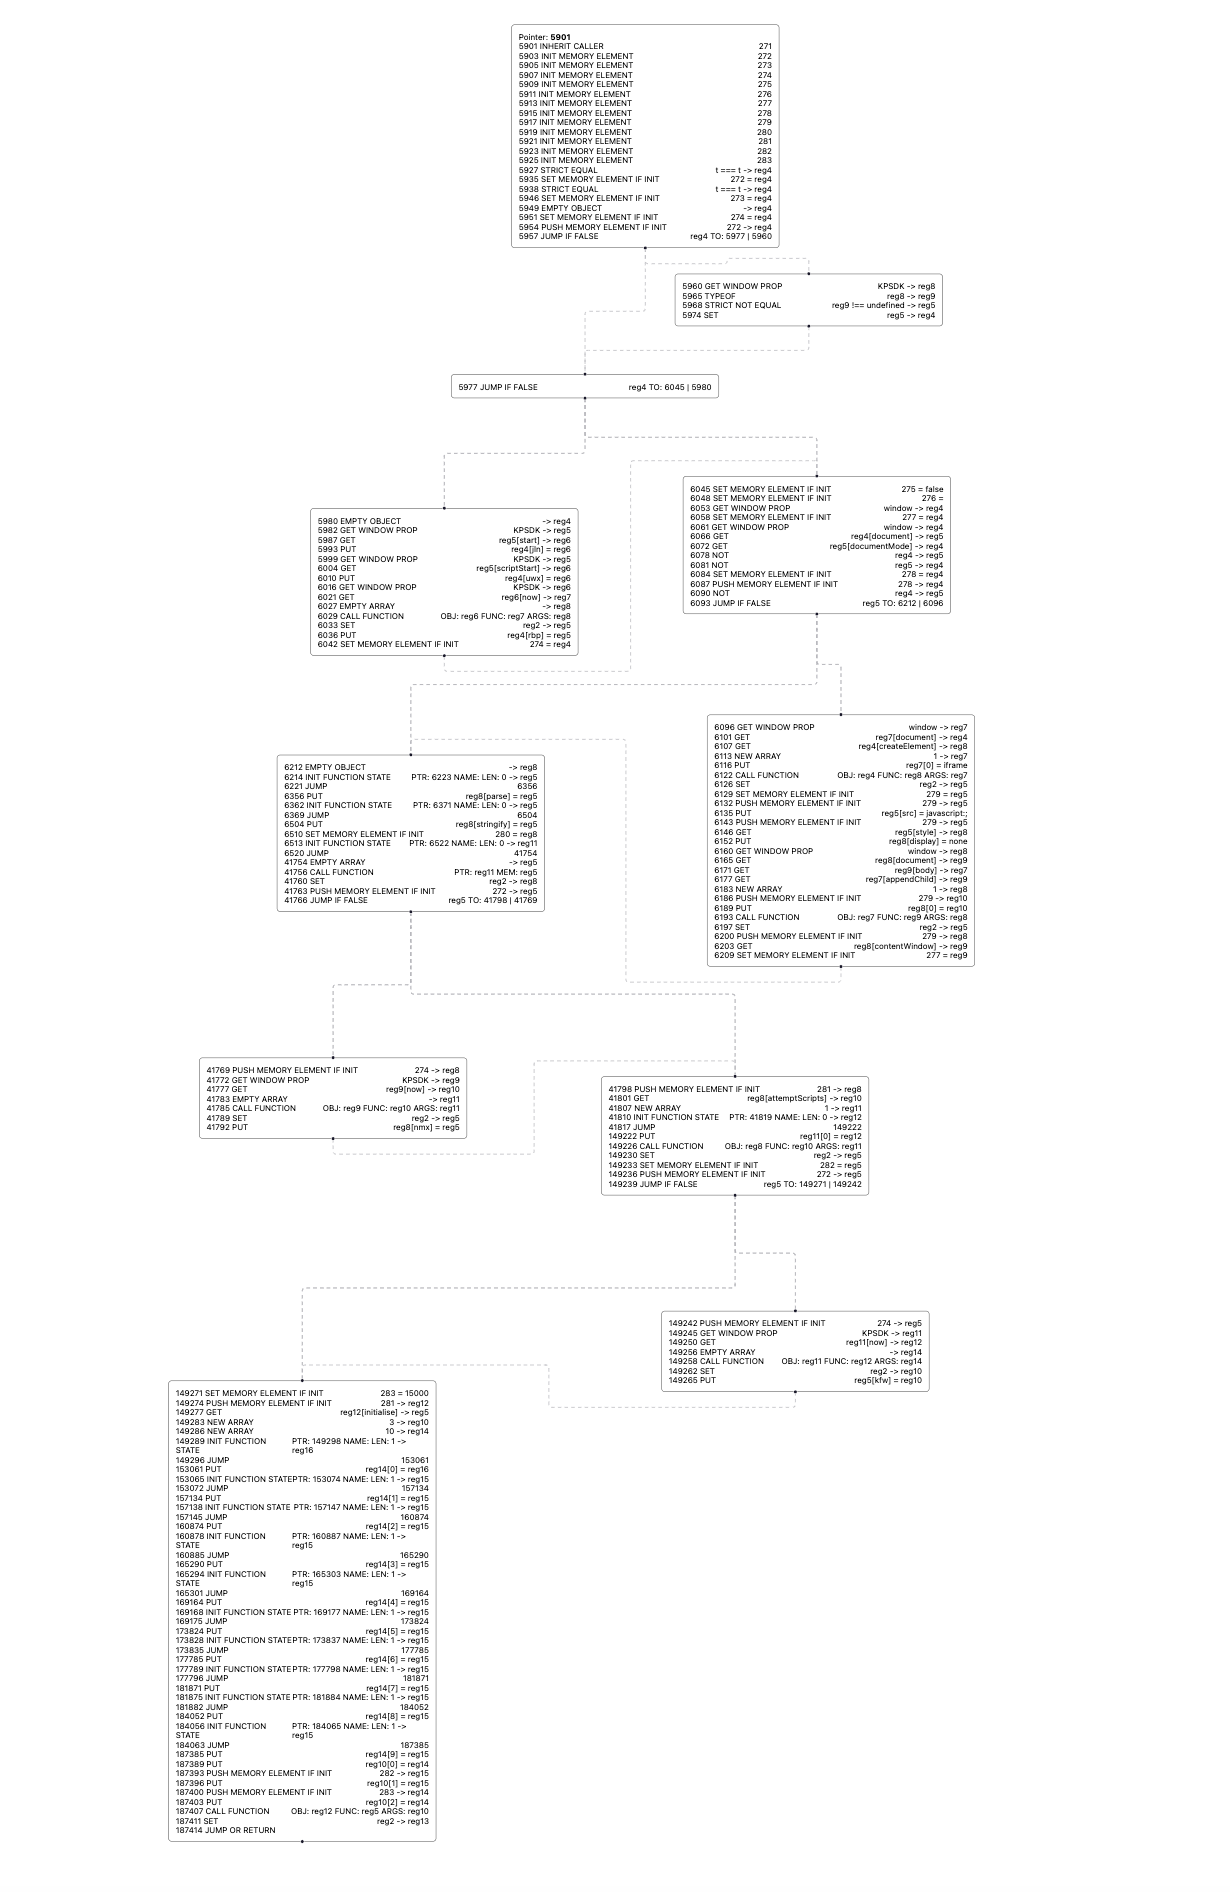
As a last note, you might find the branch output of the disassembler difficult to understand, as branches are not disassembled where they are created but instead disassembled in a recursive descent algorithm. To solve this problem, I have included a graph view repository, which although a little messy works quite well to reconstruct control flow. You can find that here. Either way, I do not feel that this affects the readability of specific blocks/functions very much, as our recursive traversal still produces the basic building blocks of the VMs control flow. We need only to read them in the right order.
Future Work
There still remains the problem of decompilation. A cursory decompilation would not be too difficult to produce. However, decompiling our output into JavaScript that resembles human-written code is a difficult task, and requires a lot of pattern recognition and compiler theory. Namely, we will have to analyze recurring syntax patterns in the disassembly, and think deeply about how variable definitions, function calls, and loops are implemented both pre and post compilation. But this is a problem for another day, and may be covered in a future post.
Now that the VM can be analyzed statically, it would be useful to make dynamic analysis more practical. While the JavaScript itself is easy to debug, actually debugging the bytecode is very difficult. To this end, it would be cool to implement a GDB style debugger, capable of stepping through the bytecode in disassembled format and inspecting registers and memory. This would be a rather simple undertaking, but would be a great way to learn more about the VM. If you plan on working on this, feel free to reach out. I would recommend the webdriver Playwright.
If you think I got something wrong, please feel free to reach out to me. Much of this work was done in the last week, so it is very possible I've made an error somewhere. Either way, I'm always happy to hear from other reverse engineers/those interested in my work, even if I don't get back to you immediately.
I may not post about this topic again, depending on how long it continues to hold my interest and how hard my classes get. Either way, I will be posting about other topics in the future, so stay tuned! If you would like to connect, my socials are linked below.
Special Thanks
Once again, a few thanks are in order:
- Paul Irish: It's not every day that I get to collaborate on a project with a Google engineer, much less someone who works on a tool I use almost every day. Your contributions were invaluable to the more technical and confusing parts of this analysis. You also greatly improved my understanding of some of JavaScript's more confusing methods, and made me even more proficient with dev tools. Thanks for taking the time!
- Nic Perez, for spending hours with me in the MADD center trying to figure out why bytecode functions were being called in so many confusing ways. Additionally, a central tenet of my reversing process has been finding conventional computer architecture analogues to the more confusing opcodes, and testing to see if they worked as expected. His knowledge in both theoretical and practical computer science proved to be invaluable. You can find his stuff here.
- Once again, both Veritas and Musicbot. I wouldn't have stuck through any of this without their kind words and advice.